Master Engagement Rate LinkedIn for Maximum Visibility
Learn to calculate and improve your engagement rate linkedin with proven tactics, benchmarks, and real-world examples to boost your LinkedIn visibility.

Understanding Engagement Rate on LinkedIn
You’ve probably tracked how many people see your posts, but engagement rate digs deeper. It measures the percentage of interactions—likes, comments and shares—against total impressions. A healthy rate hovers around 2–5%, while the very best content often achieves 5–7% or more.
Typical Engagement Rate Ranges
Before we drill into the details, here’s a quick snapshot of common benchmarks:
| Engagement Level | Rate Range |
|---|---|
| Typical | 2–5% |
| High Performer | 5–7% |
| Exceptional | 7%+ |
These figures serve as a useful yardstick when you’re sizing up your own performance.
Why Engagement Matters
Engagement isn’t just vanity—it’s your content’s passport to wider distribution:
- It tells LinkedIn’s algorithm to show your post to more people.
- It cements your standing as a go-to expert in your field.
- It unlocks real-world outcomes, from new leads to partnerships.
Think of your LinkedIn feed as a bustling conference room: the more meaningful conversations you spark, the stronger your professional network becomes.
Core Drivers Of Engagement
Several elements shape your rate:
- Relevance and Timeliness: Share content that answers your audience’s burning questions right now.
- Network Quality: A well-curated circle of interested followers will engage more.
- Consistency and Timing: Regular posts at peak hours give you the best shot at early interactions.
Engagement rate isn’t a vanity metric—it reflects the strength of your professional conversations.
For instance, a well-timed thought-leadership piece can trigger comments, reshares and connection requests, all of which boosts your overall rate.
That dashboard view pinpoints which posts generate the most interactions and shines a light on your best posting windows.
Recent figures show Germany’s LinkedIn market hitting a 4.05% conversion rate on sponsored updates, outpacing the global average and tapping into 21 million registered members. Discover more insights about LinkedIn engagement in Germany on DataReportal.
You might also want to explore how impressions drive engagement on LinkedIn. Read also: how impressions on LinkedIn
Next Steps For Measurement
Armed with these insights, it’s time to gather your data and run the numbers:
- Export your post impressions and interaction counts from LinkedIn Analytics.
- Calculate each post’s engagement rate using the standard formula.
- Benchmark your results against the table above to see where you stand.
Now you’re all set to track, compare and continually improve your LinkedIn engagement.
Calculating Engagement Rate LinkedIn
Figuring out your LinkedIn engagement rate boils down to a straightforward percentage: the total number of interactions divided by the total impressions, then multiplied by 100.
At first glance, it looks like a single line of math:
( Likes + Comments + Shares ) ÷ Impressions × 100
But there’s more going on under the hood. Let’s break it down step by step so you know exactly where to pull your numbers.
That screenshot gives you a clear view of LinkedIn Analytics in action—impressions, reactions and comments all in one place.
Engagement Rate Formula Components
Before you start calculating, you need to understand what each metric represents. Here’s a quick summary:
Engagement Rate Formula Components
| Metric | Definition |
|---|---|
| Likes | Total number of ❤️ reactions your post received |
| Comments | Number of 💬 user replies |
| Shares | Count of 🔄 reshares to user feeds |
| Impressions | Total times your post appeared in feeds |
Together, these four elements form the foundation of your engagement rate.
Using Analytics And Spreadsheet
Head over to LinkedIn Analytics and select the Posts view to fetch your data. You’ll see impressions and interaction counts lined up neatly in a table.
• Navigate to the Posts section under LinkedIn Analytics
• Click Export to CSV and download your data file
• Open the CSV in your favourite spreadsheet tool
• Fill in columns for total Likes, Comments, Shares and Impressions
• Apply the formula (Sum of Interactions) / Impressions × 100 in a new column
Once your sheet calculates each post’s engagement rate, you can sort or chart the results to see which updates resonate most.
Applying The Recipe Analogy
Crunching numbers on clicks and reactions can feel abstract. So imagine you’re baking a cake: each metric is an ingredient that adjusts the flavour.
- Likes are the sugar – they add the initial sweetness.
- Comments act like spices – they bring depth and spark conversation.
- Shares serve as the garnish – they spread your message to fresh audiences.
- Impressions are the flour – they form the base of the entire mix.
Just as tweaking any ingredient will change the cake’s taste, shifting these metrics will alter your overall engagement flavour.
Once you’ve set up this spreadsheet, turn it into a monthly report so you can spot trends or sudden dips easily.
Tracking engagement rate regularly reveals trends and spotlights content anomalies fast.
Rather than staring at raw counts, chart your engagement rates over time to visualise performance swings. For a deeper dive into pulling and interpreting your post metrics, explore our LinkedIn post analytics guide on Postline.ai.
Example Calculation Walkthrough
Let’s walk through a real example. Suppose one of your updates earned 120 Likes, 30 Comments and 20 Shares from 5,000 Impressions.
Plug those numbers into the formula:
(120 + 30 + 20) ÷ 5,000 × 100 = 3.4%
That result means about 3.4 out of every 100 people who saw your post took action.
| Post Metric | Value |
|---|---|
| Likes | 120 |
| Comments | 30 |
| Shares | 20 |
| Impressions | 5,000 |
| Engagement Rate | 3.4% |
This 3.4% figure sits comfortably within the 2–5% range most industries consider healthy.
Tips To Spot Anomalies
Your engagement spreadsheet can also act like a smoke alarm: it flags anything out of the ordinary.
- Scan for sudden spikes or drops compared to your average
- Note if a change in content type or post timing coincides with that shift
- Consider what external events (news cycles, holidays) might have influenced attention
When you identify an outlier, dive into the comments and shares to read the sentiment behind the numbers. A simple calendar reminder each month keeps this review from slipping through the cracks.
Automating Recurring Reports
Manually updating a sheet every month can get tedious. Here’s how to offload the heavy lifting to automation:
- In Google Sheets, set up a formula that pulls data from your LinkedIn API export
- Use tools like Zapier or Integromat to schedule weekly or monthly CSV imports
- Build charts with dynamic ranges that update as new rows arrive
- Apply conditional formatting to highlight any rates falling below your benchmark
With this in place, your dashboard refreshes itself, leaving you free to focus on crafting content. Set up email alerts so you hear about engagement swings the moment they happen.
Industry Benchmarks For Engagement Rate LinkedIn
Benchmarks act like signposts on a road trip. They tell you if your LinkedIn engagement is cruising smoothly or needs a nudge. Globally, the average engagement rate on LinkedIn is 3.4%, while the top-performing industries hover around 4–5%. In Germany, that figure often climbs even higher thanks to a strong B2B network and lively community discussions.
Monthly Trends In Germany
Tracking month by month reveals the rhythm of engagement—and the peaks you can aim for. Here’s a snapshot of how German organisations performed in the first half of 2025.
Monthly engagement rates on LinkedIn in Germany from January to June 2025:
Monthly Engagement Trends In Germany
| Month | Engagement Rate |
|---|---|
| January | 4.20% |
| February | 4.50% |
| March | 5.76% |
| April | 5.20% |
| May | 5.00% |
| June | 4.80% |
This data makes the Q1 growth undeniable and highlights the slight mid-year adjustment. Use these figures as a realistic reference when you map out your quarterly goals.
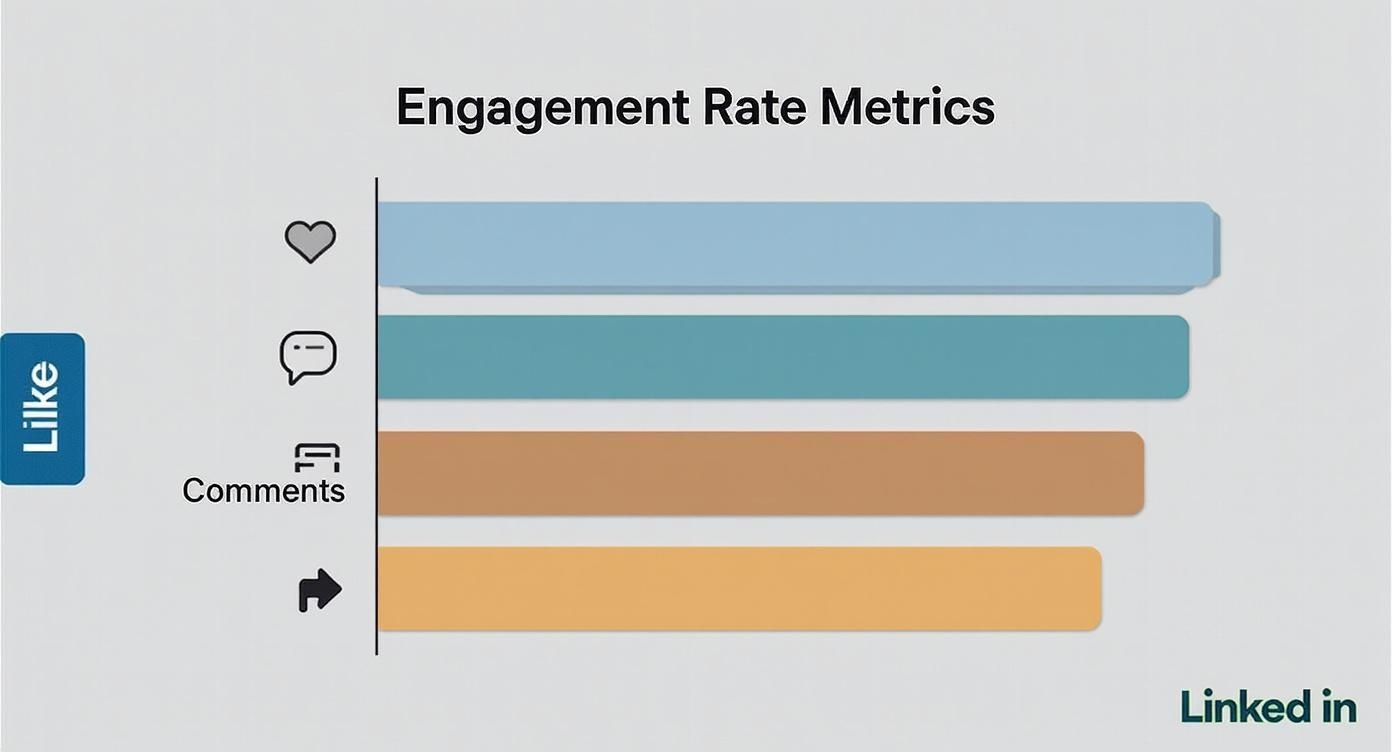
That visual breaks down likes, comments and shares—showing exactly which interactions push your engagement rate higher. For deeper insights, check out the latest Socialinsider report.
Top Industries And Age Groups
Some fields consistently outperform others on LinkedIn. Financial services and consumer goods lead at about 3.9%, while technology and healthcare settle around 3.6%. Age also plays its part:
- 25–34 years old: 4.2% engagement
- 35–44 years old: 3.8% engagement
- 45–54 years old: 3.3% engagement
Industry and age both shape how content resonates and prompts action.
Want to align your content with these benchmarks? Discover actionable methods in our guide How To Measure Content Performance.
Why Text Posts Are Rising
Text-only updates have become the unsung heroes of conversation. They invite quick replies and cut through the noise:
- Direct questions spark replies faster.
- Short, snappy messaging suits brief daily sessions.
- Audiences now favour quick reads over heavy visuals.
These simple formats are driving comment counts up—so don’t hesitate to test text-first posts in your next campaign.
Applying Benchmarks To Your Strategy
Real-world data isn’t just for reading—it’s for acting on. Here’s how to translate these benchmarks into tangible steps:
- Compare your last ten posts against Germany’s monthly average to spot gaps.
- Craft headlines tailored to the 25–34 demographic if they show 4.2% engagement.
- Measure your text posts against the 4% national average before doubling down.
- Align your publishing schedule with April’s 5.20% peak window.
- Audit industry leaders weekly to uncover high-impact themes.
Regularly revisiting these targets will turn numbers into strategic improvements—and help you maintain upward momentum.
Comparing Content Formats Globally
Globally, different formats hit different notes. Here’s how they stack up:
| Format | Global Rate | Germany Rate |
|---|---|---|
| Text | 3.2% | 4.0% |
| Image | 3.5% | 3.7% |
| Video | 3.8% | 3.9% |
These stats reveal where to shift your content investment. Actionable next steps:
- Allocate at least 30% of posts to video if you’re under 10% video today.
- Boost text-only updates until you match Germany’s 4% average.
- Experiment with mixed-media carousels when image engagement falls below 3.7%.
By staying data-driven, you’ll ensure every piece of content works harder for your objectives.
Common Mistakes to Avoid

Seasoned professionals often trip up when optimising their LinkedIn engagement rate. It’s all too easy to chase vanity metrics while genuine conversations slip through the cracks.
Below, you’ll find four predictable traps—each illustrated with a real example and a clear fix. Think of these as your audit checklist to keep every update on point and your brand voice intact.
Chasing Impressions Over Interactions
Focusing on sheer reach without nurturing comments is like hosting a party and never speaking to a single guest.
For instance, a marketing lead once boasted 100,000 impressions but only racked up 200 clicks—an engagement rate of 0.2%.
Here’s how to shift your aim:
- Prioritise questions that invite replies and tag relevant people.
- Swap lengthy copy for an open-ended prompt that encourages discussion.
- Monitor shares and comment depth alongside impressions weekly.
- Set a minimum engagement-rate LinkedIn target of 2% before scaling up reach.
| Metric Focus | Likely Outcome |
|---|---|
| Impressions | High reach but low clickthrough |
| Interactions | Fewer views but stronger audience bonds |
Use this snapshot to pivot from vanity metrics to meaningful connections.
Ignoring Comments And Feedback
Publishing a post then vanishing is like walking away mid-conversation—it signals disinterest and hurts your standing with the algorithm.
Ignoring replies is like walking away mid-conversation; it signals disinterest.
A sales manager discovered this when a thoughtful comment on her product demo went unanswered. Potential leads simply drifted off.
Turn things around:
- Respond within 24 hours, pinning key insights and acknowledging every contributor.
- Use the “thank, expand, ask” method: thank the commenter, add context, then pose a follow-up.
- Identify top contributors and invite them to private chats.
- Track comment response time in your content calendar.
Personalised replies transform followers into advocates.
Posting At Random Times
Dropping posts whenever it suits you is like setting sail without checking the tide—your updates drown in the morning rush.
An SME shared a crucial update at midnight, only to find it buried by the next dawn.
To course-correct:
- Review LinkedIn Analytics for peak-hour data.
- Test posting slots in your main time zones.
- Use scheduling tools to maintain consistency.
- Record engagement rates by hour to refine your slots.
Timing is your silent co-author in every LinkedIn update.
Align your schedule with audience habits, and you’ll see a steady climb in engagement.
Bypassing Community Cues
Skipping group discussions and trending hashtags is like ignoring the local café where your peers gather—you lose visibility and credibility.
One consultant skipped an industry hashtag challenge and suffered a 1.5% drop in engagement.
Remedy the oversight:
- Join three relevant LinkedIn Groups and engage weekly.
- Track two trending hashtags and include them in posts.
- Schedule biweekly content inspired by group chatter.
- Solicit feedback on emerging topics within your network.
Getting involved in community conversations is essential for credibility and visibility.
| Mistake | Quick Fix |
|---|---|
| Chasing impressions | Focus on interactions |
| Ignoring comments | Respond within 24h |
| Posting randomly | Align with peaks |
| Bypassing community cues | Join relevant groups |
- Audit your last ten posts against these common mistakes.
- Embed comment time tracking into your workflow.
- Schedule reviews for your posting calendar monthly.
- Bookmark this guide to refine your LinkedIn habits regularly.
Regular audits ensure you keep momentum and guard your credibility.
Use this guide as a living document—refine your strategy with each insight. By steering clear of these pitfalls, you safeguard your reputation and accelerate growth on LinkedIn. Focus on meaningful interactions, genuine feedback and consistent timing to see your engagement-rate LinkedIn climb steadily.
Next up, let’s explore proven tactics to boost your engagement with smart content and community-driven practices.
Clean audits eliminate recurring errors.
Consistent engagement starts by avoiding predictable missteps.
Bookmark this section, revisit monthly and watch your network engagement flourish.
- Monitor your last five posts for comment activity peaks.
- Set reminders to post at your identified peak times.
- Engage with two community discussions weekly to stay present.
Avoid these pitfalls and watch your LinkedIn engagement rates skyrocket.
Start today.
Proven Tactics To Boost Engagement Rate LinkedIn
Think of your LinkedIn feed as a garden—each post needs the right care to flourish. These tactics act like precision watering, nudging your engagement rate linkedin upward with steady, deliberate effort.
Each method includes a clear micro-case or metaphor so you can see exactly how structure, advocacy and community tools drive action.
Optimize Post Structure
Start with a hook that invites readers to comment in the first two lines. Keep paragraphs brief and use bullet points to guide attention.
- Headlines first signal context.
- Visual cues like emojis or bold pull eyes.
- Questions spark replies immediately.
“Structured posts can boost reactions by up to 20% when readers know what to expect.”
For instance, scheduling posts is like watering in a garden: consistency feeds growth.
Harness Employee Advocacy
Your team can become enthusiastic ambassadors. Encourage colleagues to share genuine updates and behind-the-scenes moments to expand reach.
- Create simple sharing guidelines with example captions.
- Recognise contributions in public comments to motivate more sharing.
- Schedule monthly workshops to brainstorm team post ideas.
This tactic often lifts engagement by more than 15%, according to internal post data.
Craft Magnetic Calls To Action
A strong CTA is a gentle nudge rather than a hard sell. Place it right after you’ve delivered value.
- Use action verbs like “Tell me” or “Share your view”.
- Place CTAs after value statements not at the end only.
- Test short vs detailed prompts to see which converts.
“A simple question can double comment volume compared to a generic prompt.”
You might be interested in learning how to increase engagement beyond these tactics.
Learn more about boosting interactions in our guide on increasing engagement rate LinkedIn.
Leverage LinkedIn Groups
Relevant groups are micro-communities where your insights can spark discussion and drive traffic back to your posts.
- Identify three active groups in your niche and join them.
- Post weekly with value such as tips or industry polls.
- Acknowledge top responders to build rapport and momentum.
Consider leveraging specific content formats like social clips for LinkedIn to capture audience attention. social clips for LinkedIn
Prioritise Your Toolkit
Not every tactic works equally for all networks. Use this table to pick and order approaches based on your audience size and goals.
| Scenario | Priority Tactics | Focus Area |
|---|---|---|
| Small network | Optimize post structure, CTA focus | Interaction growth |
| Large network | Employee advocacy, group engagement | Reach amplification |
| B2B industry | Case studies, detailed stories | Thought leadership |
Tailor the order based on your content goals. Revisit performance monthly and shift priorities as your network evolves.
By combining structure, advocacy, CTAs and groups, you create a balanced approach that adapts and scales. Apply these proven tactics and watch your engagement rate LinkedIn climb steadily.
Fine Tune Post Timing
Publishing at the right hour kick-starts early interactions and signals LinkedIn to push your update further.
- Analyse your top posts for peak engagement times.
- Test posting in morning, midday and evening slots.
- Use scheduling tools to maintain consistency without manual effort.
“Timing is the silent co-author for every high-engagement post.”
With consistent posting schedules and structure in place, your content becomes a reliable resource.
Micro-case Study: A small tech startup tested posting Tuesdays at 10 am, then tracked a 25% increase in comments within four weeks. They combined this timing tactic with bold CTAs and saw a ripple of new connections and messages.
Action Steps
Implement these tactics one at a time to gauge impact.
- Start with structure tweaks and track engagement changes.
- Add clear CTAs and test wording variations.
Hit publish.
Real World Examples And Use Cases
Three hands-on campaigns by German B2B pros and SMEs show you how to push up your LinkedIn engagement rate in practice. Each story drills down on strategy, execution, results and takeaways you can use immediately.
Case Study One Sponsored Update Drive
A Berlin-based tech consultancy aimed its sponsored posts at CFOs within mid-market firms. They kicked off with a 3.1% engagement rate and experimented with personalised headlines and expert quotes.
- Defined mid-market CFOs as their prime audience.
- Ran three ad copy variations with clear CTAs.
- A/B tested headlines and refined visuals.
- Checked performance daily to shift budget to top performers.
In just four weeks, their rate jumped to 5.4%, marking a 74% lift. The key lesson? Iterate creative elements quickly and lean on real-time LinkedIn Analytics.
Case Study Two Live Video Series
A Munich agency launched a weekly live talk show, inviting niche experts to co-host. They teased each episode with countdown banners and collected viewer questions in advance.
- Focused topics on pressing German B2B challenges.
- Promoted the show two days prior via feed and events.
- Asked viewers to tag peers in the comments.
- Turned highlights into short clips for broader reach.
Engagement kicked off at 1.8% and soared to 6.2% by episode six. Their secret sauce? A tightly timed 20-minute format and a Tuesday 11 am slot that resonated. As one host put it:
“Going live turned passive viewers into active participants within seconds.”
Case Study Three Micro Consultancy Advocacy
A niche HR consultancy rallied five employees to share authentic takes on cloud software challenges. Using ready-made templates, the team brought fresh voices to the conversation.
| Phase | Engagement Rate |
|---|---|
| Individual posts | 2.5% |
| Advocacy posts | 7.1% |
After a one-hour storytelling workshop, their rate leapt from 2.5% to 7.1% in four weeks. Want to dig deeper into these tactics? Check out Gong’s LinkedIn growth strategy.
These blueprints prove that targeted ads, live video and employee advocacy can each drive up your LinkedIn engagement rate. Try one method at a time, measure the impact and refine as you go.
Key Takeaways And Next Steps
- Document your baseline engagement rate before launching any campaign so you can measure genuine lift.
- Test several creative versions and tweak them based on early data.
- Keep an eye on your LinkedIn Analytics dashboard daily to catch trends and outliers.
- Scale up tactics that work and pause those that don’t to optimise spend.
- Share wins and insights with your team to fuel faster iteration.
With these examples in your toolbox, you’re ready to design your next LinkedIn push. Pick a case study, adapt its blueprint, track your metrics and refine relentlessly. Start small, measure ruthlessly and scale what sticks.
FAQ
When it comes to engagement rate on LinkedIn, a few key questions tend to surface. Below, you’ll find clear, experience-driven answers designed to help you sharpen your approach.
Q What Is A Good Engagement Rate On LinkedIn
In most industries, a healthy engagement rate sits between 2–5%. In more established markets, the very best profiles often land in the 5–7% range, and exceptional content can exceed 7%.
- 2–5% is the industry norm
- 5–7% marks high performers
- Anything above 7% signals standout content
Q How Often Should I Post To Improve Engagement Rate
Aim for 2–3 high-value posts per week. That frequency keeps your presence regular without overwhelming your network. Track when your audience is most active and fine-tune your schedule accordingly.
Tracking Engagement
Q Can I Use Automation Tools Without Hurting Engagement Rate
Automation can be your ally—so long as you pair it with genuine, timely replies. Schedule posts in advance, but treat notifications as prompts for real, human interactions.
Scheduling without personal follow-through is like planting seeds and never watering them.
Q How Do I Track Engagement Improvements Over Time
Think of your analytics as a garden: you need to tend it regularly. Export your data each month and plot metrics like likes, comments, shares and impressions. Scanning those charts will reveal which topics spark conversation and which ones need pruning.
Action Plan
Each month, run through this checklist to keep your strategy on point:
- Export your analytics report and update your spreadsheet
- Visualise engagement-rate trends to spot peaks and dips
- Shift your posting schedule toward peak interaction windows
- A/B test formats—text, images, polls—and record top performers
- Share your biggest wins to motivate your network
By repeating these steps, you’ll nurture a sharper content plan and watch your LinkedIn engagement rate climb over the coming months. Stay consistent, celebrate every milestone and adjust your goals as new benchmarks emerge.
Supercharge your LinkedIn engagement with Postline.ai

Run every client pipeline in one place
Give each LinkedIn profile its own voice, calendar, approval flow, and analytics. Start in minutes.
Start free trial