LinkedIn Post Analytics: Turn Data Into Engagement Gold
Master LinkedIn post analytics to boost engagement and reach. Discover insider strategies from top professionals who've cracked the code.

Why Your LinkedIn Data Tells a Better Story Than You Think
Many professionals look at their LinkedIn post analytics like a simple report card—high numbers are good, low numbers are bad. But if you stop there, you’re missing the real story. Your data isn’t just a scoreboard; it’s a goldmine of insights into your audience, their interests, and what they need professionally. When you learn to read these stories, you can move from posting randomly to creating content that truly connects.
Think about it this way: a single post is one conversation. But your analytics dashboard is like listening in on hundreds of conversations about that same topic. It tells you what hit the mark, what missed, and most importantly, why. This is where a real content strategy is born.
From Vanity Metrics to Actionable Insights
Top creators on LinkedIn aren’t just chasing likes and impressions. They dig deeper into analytics that point to genuine professional interest. Sure, a bunch of likes feels good, but a spike in comments from specific job titles or a high click-through rate on a document you shared tells a much more powerful story. These are the metrics that can lead to actual opportunities.
For instance, a high number of reposts means your content was so valuable that people were willing to share it with their own network, putting their professional reputation on the line. That’s a huge signal of trust. On the other hand, lots of impressions with very little engagement might mean your opening hook was great, but the content didn’t quite deliver on the promise.
Decoding Your Audience’s Digital Body Language
Your LinkedIn post analytics are full of clues about how your audience behaves. Let’s look at a few scenarios:
- Who is actually engaging? Are the comments coming from VPs of Sales or junior marketers? Knowing the job titles and industries of your engaged audience tells you if you’re hitting your target.
- What gets people talking? A post with fewer likes but a ton of thoughtful comments means you’ve struck a chord. That’s a topic you should definitely explore more.
- When are they online? By looking at when your posts get the most traction right after you publish, you can start to figure out the best times to post for maximum visibility.
Understanding these patterns is key to growing your presence. With LinkedIn seeing 1.77 billion visits in a single month as we approach 2025, the potential audience is massive, especially within the core 25-34 age group. Diving into your analytics helps you find the right way to reach them. You can learn more about these trends by checking out the latest LinkedIn demographic data.
Ultimately, analytics turn your content from a monologue into a dialogue. They help you listen to what your audience is telling you with their clicks, comments, and shares. For more on turning these insights into great content, you might find our guide on how to write standout LinkedIn posts helpful. This shift from just broadcasting your message to actively listening is what builds a powerful professional presence.
Finding Your Analytics Dashboard Without the Headache
Jumping into your LinkedIn post analytics shouldn’t feel like you need a map and compass. The good news is that LinkedIn has made it fairly simple to find your data, whether you’re on a desktop or scrolling through your phone. However, the path you take and the data you see can differ slightly depending on your account type—a personal profile versus a Company Page.
For your personal profile, the process is very direct. Just head over to one of your posts and click the “View analytics” button right underneath it. This instantly opens a dashboard showing impressions, engagement, and even demographic data about who saw your post. It’s a great way to get a quick pulse check on how your content is doing. While this in-post access is convenient, I’ve found that comparing multiple posts means clicking in and out of each one, which can get a bit repetitive.
This infographic breaks down the typical flow for reviewing your post performance, highlighting the key engagement metrics you’ll see first.
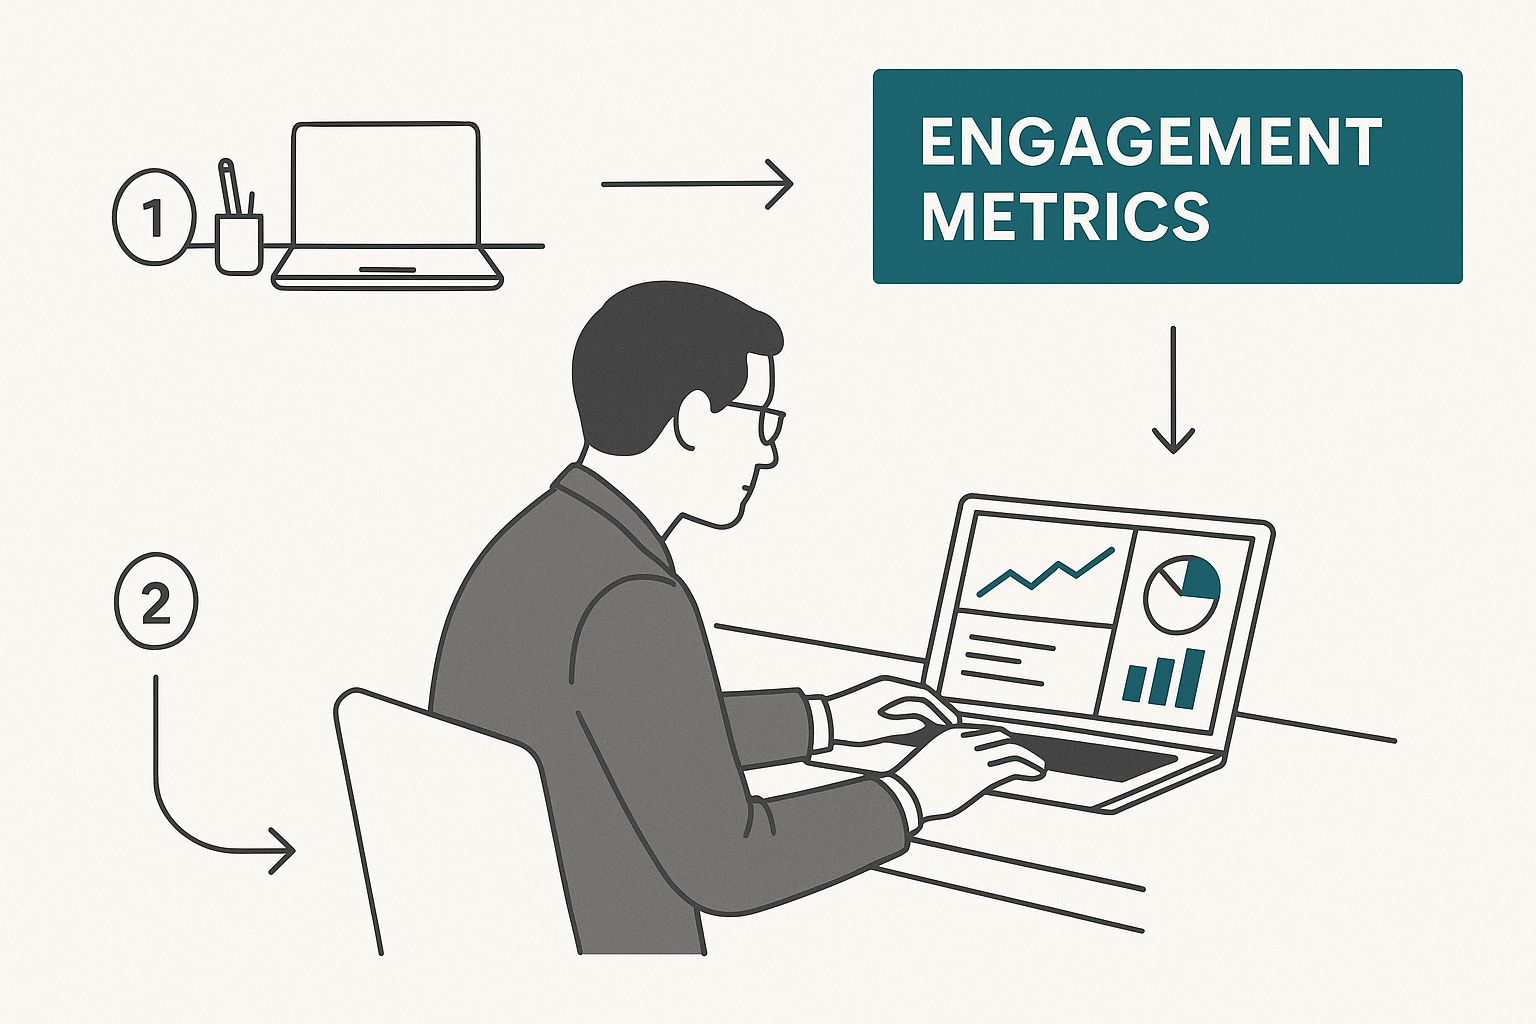
As you can tell, the initial view focuses on reactions, comments, and reposts. This gives you an immediate feel for how your audience is interacting with what you’ve shared.
Personal Profile vs. Company Page Analytics
Accessing analytics for a Company Page involves a slightly different route. As a page admin, you’ll need to go to your page and select the “Analytics” tab from the main menu. From there, you can explore data on visitors, followers, and specific content performance. This centralized dashboard is more powerful, offering the ability to export data and view trends over a selected time period—a feature not available for personal profiles. The key difference is the scope: personal analytics are post-by-post, while Company Page analytics give you a bird’s-eye view of your entire page’s health and content strategy.
To help you decide which method is right for your needs, here’s a quick comparison of the different ways you can access your LinkedIn analytics.
| Access Method | Account Type Required | Available Metrics | Best For |
|---|---|---|---|
| Individual Post Analytics | Personal Profile | Impressions, Reactions, Comments, Reposts, Viewer Demographics (Job Title, Location, Company) | Quick, on-the-fly performance checks of a specific post. |
| Centralized Analytics Tab | Company Page Admin | Visitor demographics, Follower trends, Content impressions & engagement, Lead gen form data | In-depth analysis, tracking growth over time, and exporting data for reports. |
| Mobile App (Post View) | Personal & Company Page | Basic engagement (Likes, Comments, Reposts) and Impressions | Checking basic engagement numbers while away from your computer. |
| Mobile App (Page Analytics) | Company Page Admin | A simplified version of the desktop analytics, including visitor and follower metrics. | Monitoring page health and top-performing content on the go. |
This table shows that while personal profiles offer easy-to-access, granular data for individual posts, Company Pages provide a much more robust and holistic set of tools for serious content strategy analysis.
What if My Analytics Look… Off?
It’s a common frustration: one day your analytics are there, the next they seem to have vanished or show conflicting numbers. This often happens during platform updates or if you’re viewing data from different access points, like the mobile app versus the desktop site.
If your numbers seem inconsistent, here are a few things to try:
- Clear your browser cache and cookies.
- Check from a different device to see if the issue persists.
- Give it some time—LinkedIn’s data processing can sometimes have slight delays.
The most important thing is to establish a consistent method for checking your LinkedIn post analytics. By always using the same device and access point, you ensure you’re comparing apples to apples and can trust the trends you’re seeing.
The Metrics That Actually Move the Needle
When you first peek into your LinkedIn post analytics, it’s easy to feel overwhelmed by all the numbers staring back at you—impressions, clicks, reactions, you name it. But here’s the secret: only a handful of those figures actually tell you if you’re making real progress. To get the full picture, you have to look past the surface and focus on the essential content performance metrics that show what genuinely connects with your audience.
Think of it like driving a car. The speedometer is nice to look at, but it’s the fuel gauge and engine temperature that tell you if you’ll actually make it to your destination.
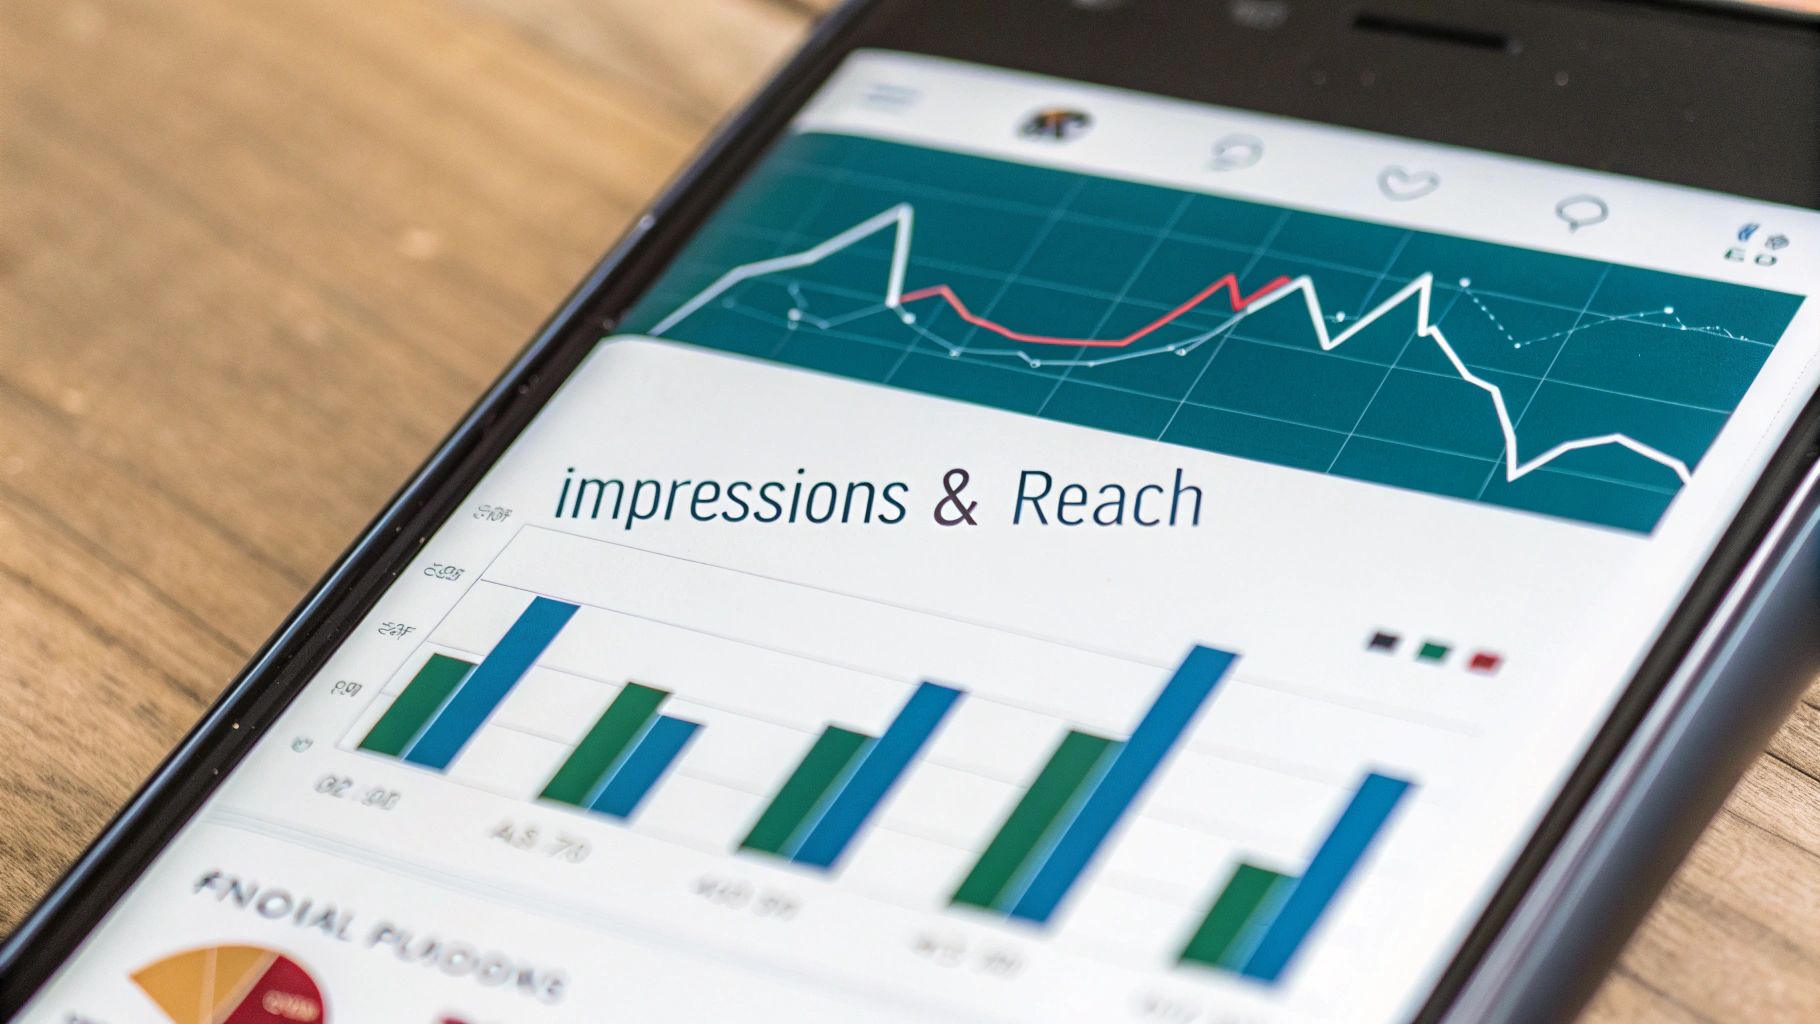
Beyond Impressions: Metrics That Signal Real Interest
Impressions are just the starting line. They tell you how many times your post appeared on someone’s screen, but they don’t reveal if anyone stopped scrolling. The real story is told by metrics that show someone actively engaged, not just passively glanced.
- Comments: This is where the gold is. A thoughtful comment means your post was so compelling that someone paused their day to think and add to the conversation. I always pay more attention to the quality of the comments than the sheer number. Are people asking insightful questions or sharing personal stories? That’s a huge win.
- Reposts: When someone shares your content with their network, they’re essentially giving you their stamp of approval. It’s a powerful sign of trust that can dramatically expand your reach to new, relevant audiences who are more likely to listen.
- Click-Through Rate (CTR): If you’ve included a link in your post—whether to an article, your portfolio, or a product page—the CTR is a make-or-break metric. It directly measures how well your call-to-action worked and shows that someone was interested enough to take the next step.
Understanding Engagement Rate and What It Means for You
Your engagement rate, which is the total interactions divided by impressions, is a vital sign of your content’s health. In 2025, the average engagement rate by impressions on LinkedIn is a solid 5.00%. Interestingly, multi-image posts are leading the pack with an impressive 6.60% engagement rate, proving that a little visual storytelling goes a long way.
If you’re hitting these numbers, you’re doing great. To see how you stack up across different formats, you can discover more about these social media benchmarks and adjust your strategy accordingly.
To help you get a clearer idea of what works, here’s a breakdown of different content types and what you can expect from them.
| Content Type | Average Engagement Rate | Best Use Cases | Optimization Tips |
|---|---|---|---|
| Multi-Image Posts | 6.60% | Showcasing project portfolios, event highlights, step-by-step guides. | Tell a visual story. Ensure the first image is compelling enough to make users swipe. |
| Polls | 5.50% | Gathering audience feedback, starting conversations, market research. | Keep questions simple and relevant. Engage with commenters who elaborate on their votes. |
| Video Posts | 5.20% | Behind-the-scenes content, expert interviews, product demonstrations. | Keep videos short (under 90 seconds). Add captions, as most users watch with sound off. |
| Text-Only Posts | 4.90% | Sharing personal stories, industry insights, asking thought-provoking questions. | Use white space and short paragraphs to improve readability. Start with a strong hook. |
| Document/Carousel Posts | 4.50% | Sharing in-depth guides, reports, or presentations. | Design for mobile viewing. Use a compelling title slide and a clear call-to-action on the last slide. |
Ultimately, making sense of your LinkedIn post analytics is about tying the data back to your personal goals. Are you on the hunt for a new job? Then profile views and connection requests from recruiters are your key metrics. Trying to generate leads for your business? A high CTR on links to your services page is what you should be watching.
By focusing on the right numbers, you stop chasing vanity metrics and start making strategic moves that truly matter. For more tips on crafting content that hits the mark, check out our guide on LinkedIn post best practices.
Unlocking LinkedIn’s Hidden Analytics Superpowers
If you’ve ever felt like likes and comments only tell part of the story, you’re right. LinkedIn has been rolling out some powerful features that give you a much clearer picture of your content’s true impact. These “hidden” superpowers let you track the path someone takes after seeing your post—from the initial view to a profile visit and even a new connection. This deeper layer of LinkedIn post analytics is where you can genuinely measure your influence.

Think about it this way: you share a detailed case study. Instead of just seeing it received 500 likes, you can now discover that it drove 75 people to your profile. That’s a huge piece of information. It means your content was compelling enough to make people curious about you—the person behind the insights. As of May 2025, LinkedIn has officially added “Profile activity” to track how posts lead to profile visits and new followers. You can read more about these expanded LinkedIn data insights to see how they can inform your strategy.
Is a Premium Upgrade Worth It for the Data?
This leads to a common question: should you pay for LinkedIn Premium just for the extra analytics? For many professionals, the answer is yes, but only if you actually use the data to make decisions. Premium accounts often get a first look at new analytics features and can see more detailed demographic information about who viewed your posts, including their specific companies and job titles over a longer timeframe.
This granular detail helps you answer some critical questions about your content:
- Am I reaching decision-makers at my target companies?
- Which topics resonate most with senior leaders in my field?
- Is my content attracting the right kind of professional connections?
The key is to not just look at this data but to act on it. Use these insights to create more content on topics that attract your ideal audience and to sharpen your messaging. When you’re ready to really dig into this information, you can check out our guide on how to export data from LinkedIn analytics to Excel for more advanced analysis.
Transforming Analytics Into Content That Connects
Having a dashboard full of numbers is one thing; knowing what to do with them is where the real magic happens. Your LinkedIn post analytics are the breadcrumbs that lead to a content strategy that actually works. The idea is to stop just looking at data and start using it to make smart choices about what you post, when you post it, and how you talk to your network. This is how you stop guessing and start building real connections.
Let’s say you’re a sales consultant. You might notice that your posts about specific negotiation tactics get way more comments and reposts from people with “Director of Sales” in their titles than your generic industry news. That’s not just a nice number; it’s a signal from your ideal customer. This insight tells you to double down on tactical, how-to content because that’s what your target audience finds genuinely useful. The raw numbers just gave you a roadmap.
From Data Points to a Dynamic Content Calendar
A great way to put your analytics into practice is with a quick content audit. Go back and look at your last 10-15 posts. Sort them by topic and format, then pop them into a simple table to see how they stacked up against each other.
| Content Theme | Format (Text, Video, Poll) | Top Metric (Comments, Reposts) | Key Takeaway |
|---|---|---|---|
| Industry News | Text-only | Impressions | Good for visibility, but low on interaction. |
| Personal Story | Multi-image | Reactions & Comments | Builds a strong, personal connection. |
| Tactical Advice | Carousel/Document | Reposts & Profile Clicks | Positions me as an expert and gets people to act. |
This simple exercise can show you patterns you might have totally missed. For example, maybe you see that your audience is most active and engaged on Tuesday and Thursday mornings, based on how quickly your posts get traction. That one piece of information can immediately shape your posting schedule for the better. Or you might find that polls get a ton of votes but very few real comments, telling you they’re better for quick feedback than for starting deep conversations.
Testing and Refining Your Strategy
Your analytics are also the perfect playground for trying out new ideas. Come up with a hypothesis based on what you’ve seen in your data, and then test it with your next post.
- Hypothesis: “If my audience loves reposting tactical content, they’ll probably engage with a short video tutorial on the same kind of topic.”
- Test: Create and post a 90-second video explaining a quick negotiation tip.
- Measure: Keep an eye on the video’s views, comments, and profile clicks. See how these numbers compare to your text-based tactical posts.
To really turn your analytics into content that connects, you have to get a feel for your audience and what makes them tick. This approach changes your LinkedIn post analytics from a boring historical report into a forward-looking guide. It’s a continuous cycle of listening, interpreting, testing, and tweaking that builds momentum and makes you a voice people actually want to hear from.
Solving the Analytics Puzzles That Stump Everyone
Even the most experienced LinkedIn users sometimes find themselves staring at their analytics, completely baffled. One week your impressions skyrocket, and the next, they’ve completely vanished. Or perhaps the numbers on your phone don’t quite line up with what you see on your desktop. These confusing moments happen to everyone, and they usually have simple explanations that aren’t immediately clear. It’s not always about your content; sometimes, it’s just how the platform works.
The usual suspect behind these sudden metric changes is often an algorithm update. LinkedIn is always adjusting how it presents content to create a better experience for users. For instance, a recent update that prioritizes posts from verified accounts might temporarily lower your reach if you haven’t completed the verification process. We’ve previously covered how to get a potential LinkedIn algorithm boost with a verified profile, which can help bring some stability back to your visibility. Knowing about these background changes is the key to not overreacting when your numbers fluctuate.
Making Sense of Conflicting Signals
So, what should you do when one metric is soaring while another is tanking? Picture this: a post racks up thousands of impressions but gets almost no comments. This isn’t a failure; it’s a very specific piece of feedback. It tells you the topic was relevant enough for LinkedIn to show it to a lot of people, but the hook or the content itself didn’t quite convince them to join the conversation.
Here’s how you can decode these common analytics puzzles:
- High Impressions, Low Engagement: Your content is getting seen, but it’s not prompting people to act. Try asking a direct question or using a more thought-provoking opening line in your next post to encourage a response.
- High Reactions, Low Reposts: People appreciate your content, but they might not see it as valuable enough to share with their own networks. This is common with personal stories or updates. To fix this, focus on providing actionable advice or unique insights that make people want to be known for sharing it.
- Conflicting Data Across Devices: If you notice your mobile and desktop analytics don’t match up perfectly, don’t sweat it. This is typically just a small delay in data synchronization. For the most accurate and complete picture, trust your desktop analytics, especially when you’re looking at trends over time.
Instead of getting frustrated, start treating these puzzles in your LinkedIn post analytics as valuable clues. They’re pointing you exactly where you need to tweak your strategy to get better results next time.
Your Personal LinkedIn Analytics Playbook
Turning raw data into a real system is what separates a lucky viral post from actual, long-term growth. Creating your personal LinkedIn post analytics playbook isn’t about obsessively checking numbers every day. It’s about building a repeatable process that leads to genuine improvement. This means setting a consistent schedule for reviews, defining what success actually looks like for you, and forming habits that turn insights into action.
First, find a simple rhythm for your analysis. A quick weekly check-in is great for noticing short-term trends and making small tweaks. Then, block out time for a deeper monthly review to see how you’re tracking against your bigger professional goals. This two-level approach keeps you from overreacting to daily ups and downs while ensuring your strategy stays on course.
Establishing Your Benchmarks
Success on LinkedIn is personal; it’s not a one-size-fits-all game. Your benchmarks should be a direct reflection of your professional goals. I find it helpful to create a simple table to keep track of what really matters, which helps cut through the noise and focus on the metrics that signal real progress.
| Professional Goal | Key Metric to Track | Success Indicator | Warning Sign |
|---|---|---|---|
| Build Thought Leadership | Reposts & High-Quality Comments | A growing number of shares by people you respect in your industry. | Lots of impressions but comments are generic or shallow. |
| Generate Business Leads | Click-Through Rate (CTR) on Links | More traffic heading to your services page or lead magnet. | High engagement on the post, but almost no one clicks your call-to-action. |
| Grow Professional Network | Profile Visits & New Follower Demographics | An increase in followers from your target companies or job roles. | Follower count is growing, but they’re from totally irrelevant industries. |
| Find a New Job | Recruiter Profile Views & InMail Responses | Seeing more profile views from recruiters right after you post. | Your peers are engaging, but you’re not getting seen by hiring managers. |
The Habit of Continuous Improvement
Your analytics playbook should be a living, breathing guide, not some static report you glance at once. Each week, pull out one key takeaway from your LinkedIn post analytics and turn it into a small experiment for the next week. For instance, if you notice a post with a personal story got 2x the average number of comments, your action item is simple: test another post with a personal anecdote.
This simple cycle—review, benchmark, experiment—creates an incredibly powerful feedback loop. It guarantees you’re not just passively looking at your data but actively using it to sharpen your voice, improve your content, and build a presence that delivers tangible professional results.
Ready to make your content strategy smarter and more efficient? Postline.ai combines powerful AI with deep personalization, helping you turn analytics insights into standout LinkedIn posts in minutes.

Run every client pipeline in one place
Give each LinkedIn profile its own voice, calendar, approval flow, and analytics. Start in minutes.
Start free trial