How to Measure Content Performance That Matters
Learn how to measure content performance with a focus on business goals, not just vanity metrics. Get actionable advice on KPIs, tools, and analysis.

To really nail content performance, you have to connect your work to actual business goals. It’s a constant feedback loop: you set objectives, measure your progress, and then tweak your strategy. This isn’t about chasing traffic for traffic’s sake. It’s about shifting your focus from vanity metrics to what I call value metrics.
Moving Beyond Views to Value

Let’s be real: proving the actual value of content can feel like an uphill battle. For years, the conversation has been stuck on surface-level numbers like page views and impressions. Sure, those metrics aren’t totally useless, but they don’t paint the full picture.
Think about it. A blog post with 100,000 views that generates zero leads is far less valuable than one with just 1,000 views that brings in five high-quality MQLs. The difference is all about impact.
Measuring content performance correctly isn’t about counting how many eyeballs see your work; it’s about understanding what those eyeballs do next. It’s a fundamental shift in mindset from just attracting an audience to guiding that audience toward a meaningful business outcome.
The Shift from Quantity to Quality
The good news is the industry is finally moving away from just counting clicks and toward measuring genuine audience interest. Today, savvy marketers prioritize metrics like engaged sessions, lead quality, and content-assisted conversions over raw traffic.
For example, an “Engaged Session” in Google Analytics 4 is often defined as a visit lasting longer than 10 seconds that includes an interaction or multiple page views. That’s a much better indicator of real interest than a quick bounce. You can see how top marketers measure content marketing KPIs on wearecsg.com.
This focus on quality over quantity helps you answer the questions that actually matter:
- Is our content resonating? High engagement time and low bounce rates give you a clear signal.
- Are we attracting the right people? Lead quality scores and conversion rates tell the story.
- Does our content actually influence sales? Attribution models can show which pieces helped close the deal.
Why Vanity Metrics Fail Us
Relying only on vanity metrics is like judging a restaurant’s success by the number of people who walk past its window instead of how many come inside to eat. Page views and social media likes are easy to track and can give you a nice ego boost, but they rarely correlate with actual business growth.
To get a better handle on the subtle but crucial differences, our guide on views vs. impressions offers a deeper look.
The core of effective content measurement is asking the right question. Instead of asking “How many people saw this?” we need to ask, “What did the right people do after they saw this?”
This guide will walk you through building a measurement framework that answers that second, more important question. We’ll show you how to tie your efforts to real business objectives, pick KPIs that actually reflect progress, and turn raw data into smart, strategic improvements. It’s time to measure what matters.
Connecting Content to Your Business Goals

Before you even think about measuring content, you have to know what you’re trying to achieve. Seriously. Jumping into analytics without clear goals is like setting sail without a map—you’ll be busy, but you won’t actually get anywhere.
The first, and most important, step is to tie every article, video, and social media post back to a real business outcome. Forget vague targets like “getting more traffic.” Instead, get specific about what success looks like for your business.
For example, a B2B SaaS company is probably laser-focused on generating marketing qualified leads (MQLs) for their sales team. That’s their north star. On the flip side, a D2C e-commerce brand might care more about building an engaged community to drive repeat purchases and loyalty.
These are two completely different worlds, and they demand totally different measurement strategies. One is all about the sales funnel, while the other is tracking community growth and sentiment.
Defining Your Primary Content Objectives
So, what’s the big picture? Your first move is to anchor your content strategy to a high-level business goal. Are you trying to boost brand awareness, generate a steady flow of inbound leads, or keep existing customers happy?
Each of these objectives needs its own set of Key Performance Indicators (KPIs).
Let’s say your main goal is brand awareness. You’ll want to track metrics that prove your reach and influence are growing. Think about things like:
- Share of voice in your industry.
- An increase in branded search volume.
- Growth in social media reach and impressions.
But if lead generation is your top priority, your dashboard will look completely different. You’ll be obsessed with metrics that directly reflect the health of your sales pipeline—conversion rates, lead quality scores, and which content pieces are helping close deals.
Effective content measurement isn’t about finding a single magic number. It’s about building a narrative that explains how your content is moving the needle on the goals that your leadership team actually cares about.
Aligning KPIs with Specific Business Goals
Once you’ve locked in your main objective, you can start mapping specific KPIs to it. A simple framework connecting each goal to the metrics that prove its success is all you need.
This is where you have to get granular. Your content types—whether it’s blog posts, social media updates, or email campaigns—all need their own tailored KPIs. While some standard metrics overlap, each format has a unique role to play.
A great way to connect the dots is to adopt the same mindset you’d use for tracking your advertising ROI. If you’re running paid ads to promote an eBook, you can directly link ad spend to the number and quality of leads it generates. Applying this same discipline to your content is crucial for proving its financial contribution.
By defining success on your own terms, you stop treating content as a cost center and start showing everyone how it’s a clear driver of business growth.
Choosing the Right KPIs for Your Content
Trying to measure a blog post’s success with the same ruler you use for a TikTok video is a recipe for disaster. It just doesn’t work. Every single piece of content you create has a different job to do, which means you need to pick Key Performance Indicators (KPIs) that actually match its purpose.
Think about a deep-dive, long-form article. Success isn’t just about traffic numbers. You’ve got to look deeper at metrics that prove people are genuinely hooked. That means tracking things like scroll depth (how far are they actually reading?), time on page (are they sticking around?), and any bumps in keyword rankings to see if your SEO efforts are paying off.
Matching Metrics to Content Formats
Now, flip the script to a downloadable asset like a case study or an ebook. Here, the focus shifts completely. Your main KPIs become lead form completions, the conversion rate of the landing page, and—most importantly—the number of Marketing Qualified Leads (MQLs) it sends over to your sales team. Traffic is great, but it’s secondary to the quality of the leads.
A webinar is another beast entirely. Its performance is all about how well it engages a live audience and pushes them to take the next step. For a webinar, you’ll want to analyze metrics like:
- Registration vs. attendance rate: This tells you how strong your initial hook was and if people followed through.
- Audience engagement: Were people participating in polls or asking questions? This is a huge indicator of interest.
- Post-webinar actions: Did anyone book a demo or sign up for a trial? This is where the real value lies.
This chart gives you a quick visual on how some of the core web metrics—page views, bounce rate, and average time on page—can give you a quick health check on your content.
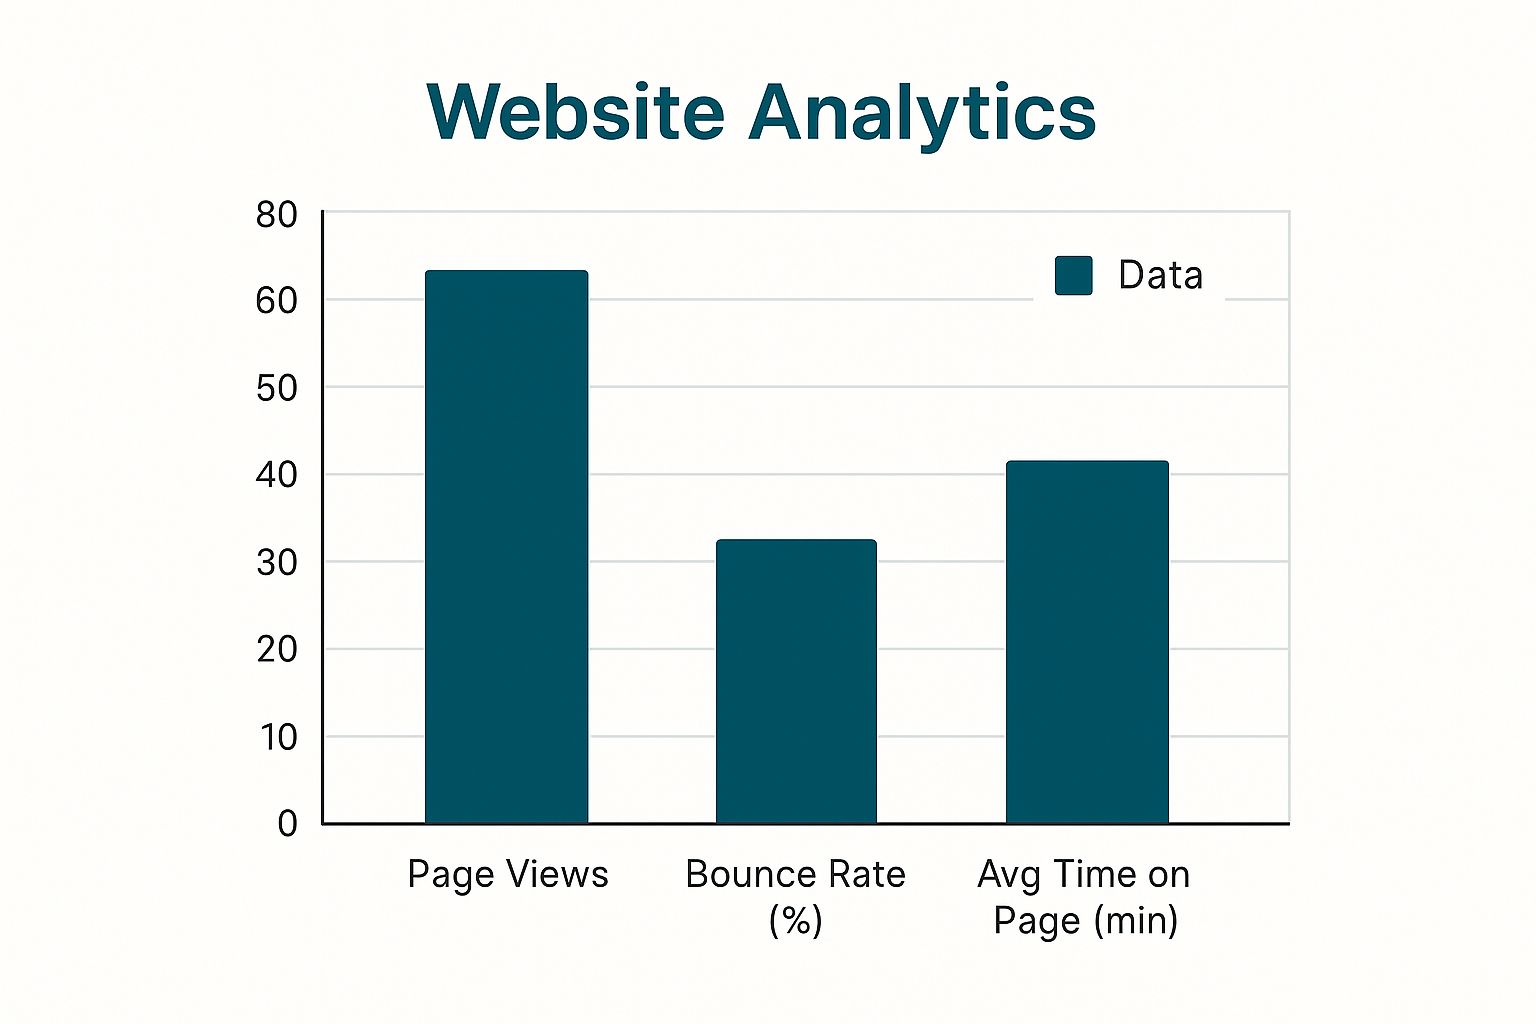
What you’re seeing here is a classic relationship between user engagement and content value. A higher time on page almost always corresponds with a lower bounce rate, which is a great signal that your content is hitting the mark.
To help you get started, here’s a quick reference table to connect common content formats with the right goals and metrics.
Matching Content Types to Key Performance Indicators
| Content Type | Primary Business Goal | Key KPIs to Measure |
|---|---|---|
| Blog Post / Article | Brand Awareness, SEO Ranking | Organic Traffic, Keyword Rankings, Time on Page, Scroll Depth, Backlinks |
| Ebook / Whitepaper | Lead Generation | Landing Page Conversion Rate, Downloads, Cost Per Lead (CPL), MQLs |
| Case Study | Sales Enablement, Conversion | Conversion Rate on Demo Requests, Leads Generated, Influence on Pipeline |
| Webinar | Lead Generation, Audience Education | Registration Rate, Attendance Rate, Audience Engagement, Post-Webinar Actions |
| Social Media Video | Engagement, Brand Building | Views, Watch Time, Engagement Rate (Likes, Comments, Shares), Follower Growth |
| Infographic | Brand Visibility, Link Building | Social Shares, Backlinks, Referral Traffic |
This table isn’t exhaustive, but it’s a solid foundation for building a reporting system that gives you real, actionable insights instead of just vanity metrics.
Building a Nuanced Reporting System
The way we measure content has come a long way from just counting page views. It’s now about a whole suite of metrics that tells a story about both audience engagement and business impact. The big KPIs people are focusing on now include Time on Page, Social Media Engagement Rate, Click-Through Rate (CTR), and the holy grail: ROI with revenue attribution.
The key to accurate measurement is context. A high bounce rate on a blog post is a problem. But a high bounce rate on a simple contact page? That might just mean the user found exactly what they needed and left satisfied.
When it comes to social media, especially on a professional platform, the KPIs are different all over again. Instead of website-centric data, you’re zeroing in on platform-specific engagement. If you’re curious about that, you can dive deeper by reading our guide on understanding your LinkedIn post analytics.
By building a reporting system that matches the right KPIs to each piece of content, you can finally move beyond surface-level numbers. You start telling a compelling story about how your content is actually driving meaningful results for the business. This isn’t just a nice-to-have; it’s fundamental to a winning strategy.
Building Your Content Analytics Stack

Knowing what to measure is one thing, but you can’t track what you can’t see. Having the right tools in your corner is absolutely non-negotiable for understanding how your content is performing. This isn’t about collecting a bunch of flashy subscriptions; it’s about building a smart, integrated system that delivers clear, reliable data.
Your analytics stack doesn’t have to be complicated, but it does need a solid foundation. For most of us in the content world, that foundation starts with two incredibly powerful (and free) platforms from Google.
The Foundational Tools
First up is Google Analytics 4 (GA4). Think of this as your home base for understanding how people behave on your site. Don’t just slap the tracking code on your website and call it a day—that’s a rookie mistake. The real magic happens when you set up custom events and conversion tracking that tie directly back to the business goals you defined earlier.
For instance, if your primary goal is lead generation, you need to create a custom event that fires every single time someone successfully submits a contact form. Just like that, you’ve turned a simple website visit into a measurable business outcome.
Next is Google Search Console (GSC). While GA4 tells you what users do on your site, GSC tells you how they find you through organic search in the first place. It’s your direct line of sight into SEO performance, providing crucial data on impressions, clicks, and keyword rankings.
A common mistake is treating GA4 and GSC as two separate islands of data. The real insights emerge when you use them together. GSC shows you which keywords are bringing people in, while GA4 reveals what those people actually do once they arrive.
This example from a Google Analytics dashboard gives a great high-level overview of user engagement and acquisition channels.
From this single view, you can quickly spot your top-performing pages and see which channels are delivering the most engaged users, helping you decide where to double down on your efforts.
Leveling Up Your Analytics Stack
Once you’ve got the basics dialed in, you can start adding more specialized tools to get a real competitive edge. Integrating SEO platforms like Semrush or Ahrefs can unlock deeper insights into keyword opportunities, your backlink profile, and exactly what your competitors are doing right.
To pull all this data together, creating an automated dashboard in a tool like Looker Studio is a total game-changer. It can automatically pull data from GA4, GSC, and other sources into a single, cohesive view. This setup saves you from getting lost in a dozen different browser tabs and makes it ridiculously easy to spot trends and share insights with your team. This kind of efficiency is a core part of a modern content creation workflow.
Ultimately, the goal is to build an analytics stack that provides a single source of truth, turning scattered data points into a clear story about your content’s real-world impact.
Turning Your Data Into Actionable Insights
Collecting data is the easy part. Honestly, anyone can set up analytics and watch the numbers roll in.
The real skill—the one that separates the pros from the pack—is knowing what to do with that information. This is where we move from just looking at numbers to asking smart questions about what they actually mean for our strategy.
Instead of just shrugging at a high bounce rate on a new blog post, the right question is, “Okay, we got the traffic, but why did this post fail to keep them on the page?” Or if you see a spike in demo requests, you dig deeper: “Which specific topics and content formats are consistently bringing in our best leads?”
This process is absolutely critical. Many great guides on mastering data analysis for marketing success will tell you the same thing: the goal is always to turn raw information into something that actually helps you make better decisions.
A Simple Framework for Analysis
It’s easy to get lost in spreadsheets and feel like you’re drowning in data. To avoid that, I use a simple but really effective framework. It’s a repeatable process for turning observations into actual improvements.
- Spot a Trend: First, just identify a pattern. It could be something positive, like seeing that articles on a certain topic always get more backlinks. Or it could be negative, like a sudden drop-off in newsletter sign-ups from your blog.
- Ask ‘Why?’: Now, dig in. Don’t just accept the surface-level fact. Why are those specific articles getting more links? Is it the topic? The format? The author? The promotion strategy?
- Form a Hypothesis: Based on your “why,” come up with a testable guess. For instance, “I believe our articles that feature original research and data visualizations earn more backlinks because they offer unique, citable value.”
- Test and Validate: Finally, design a small, manageable experiment to see if you’re right. You could create one new post packed with original data and another standard listicle, then track the backlink acquisition for both over the next month.
This structured approach changes your role from being a passive data reporter to an active content strategist.
The most valuable insights aren’t found in the data itself, but in the questions you ask of it. A dashboard can tell you what happened, but your job is to figure out why it happened and what to do next.
Building a Content Feedback Loop
Let’s walk through how this looks in the real world.
Imagine you’re reviewing your analytics and notice that three of your top-performing articles, measured by time on page, all feature quotes from industry experts. That’s your trend.
Your “why” might be that including these expert voices adds a layer of credibility and depth, making the content feel more trustworthy and engaging. This naturally leads to a hypothesis: “Content that features expert quotes will have a significantly higher average engagement time than content without them.”
Now for the fun part: you test it. Over the next month, you intentionally publish two articles peppered with expert insights and two that are written entirely in-house. Then you sit back and compare the time on page and scroll depth.
If your hypothesis holds up, you’ve just uncovered a powerful, data-backed insight.
The final, crucial step is to close the loop. This finding doesn’t just live in a spreadsheet; it gets baked directly into your future content briefs. It becomes a new best practice for your team, helping to elevate your entire content program.
This is how you use data to build authority and, over time, learn how to become a thought leader in your space. The key is creating a continuous cycle where performance data consistently fuels smarter content decisions.
Got Questions About Content Performance? We’ve Got Answers.
Even with the best game plan, you’re bound to run into some tricky questions once you start digging into your content data. It happens to everyone. Let’s walk through a few of the most common ones that pop up, so you can get unstuck and move forward.
How Often Should I Actually Be Reporting on This Stuff?
There’s no magic number here—it really boils down to your team’s rhythm and how fast you’re shipping content. That said, a great cadence I’ve seen work for most teams is a monthly deep-dive paired with a quarterly strategic review.
Your monthly check-in is for keeping your finger on the pulse. This is where you track progress against your KPIs and spot trends as they happen. You’re answering immediate questions like, “Did last month’s articles hit their traffic goals?” or “Which posts drove the most newsletter sign-ups?”
The quarterly review is where you zoom out. It’s your chance to look at the bigger picture and ask if your content is really impacting the business. Think bigger questions, like, “How did our content actually contribute to the sales pipeline this quarter?” or “Are we seeing real, sustained growth in our organic authority?”
It’s so easy to get obsessed with daily traffic spikes and dips. Unless you’re in the middle of a huge launch, checking daily stats is mostly just noise. Stick to a regular reporting schedule to focus on the trends that matter.
What’s a “Good” Bounce Rate for a Blog Post, Anyway?
Ah, the classic question. And the honest-to-goodness answer is: it depends. A “good” bounce rate is completely contextual. You’ll see industry averages floating around 40% to 60%, but that number is pretty useless without knowing the story behind it.
Think about it this way: a high bounce rate on a major pillar page—one that’s designed to guide people deeper into your site—is a big red flag. It’s telling you the content isn’t doing its job of earning the next click.
But a high bounce rate on a quick, informational post that answers a single question? That could actually be a good thing. It might mean the reader found exactly what they were looking for, got their answer, and left happy. Instead of chasing a specific number, think about the user’s goal for that page.
Can I Really Measure the ROI of a Single Blog Post?
Pinpointing the exact ROI of one blog post can be tough, but it’s not impossible. You just have to connect that post to a clear, monetizable action.
If an article is built to generate leads, you can track how many people fill out the form on that page. From there, you can huddle with your sales team to figure out the average value of those leads and calculate a pretty tangible return.
But don’t forget that a lot of content does its work indirectly. A top-of-funnel article might not pull in leads today, but it could attract amazing backlinks that boost your entire site’s SEO authority. That, in turn, helps your more conversion-focused pages rank higher. When you’re figuring out how to measure content performance, you have to look at both the direct and the indirect wins.
Ready to create LinkedIn content that consistently hits its performance goals? Postline.ai combines powerful AI writing with real-time research to help you craft standout posts in minutes, so you can grow your audience and generate leads with confidence. Start creating smarter content today at https://postline.ai.

Run every client pipeline in one place
Give each LinkedIn profile its own voice, calendar, approval flow, and analytics. Start in minutes.
Start free trial